I got off to a late start today. Earlier in the day I visited the Stone Branch Center for the Arts and Blue Ridge Arts Council regarding meeting space for our Lego Users Group (LUG). In addition, I may be training a few workshops/camps.
Yesterday I was able to detect binary data within an audio signal using two distinct frequencies to represent 0 and 1. I’ve come to learn that this modulation technique is called Frequency-shift keying (FSK). Each frequency that the oscillator creates is called a carrier signal. Ideally you would have two separate oscillators for each carrier signal, but I used only one and gave it a time for when to switch to another frequency. It’s called modulating data onto carriers when converting bits from ones and zeros to the carrier signals. The end goal is to send multiple bits at once over different frequencies, known as Multi-Frequency Signaling (MFSK) or Multi-Tone Signaling.
I was able to graph the signals for both frequencies, draw a threshold that triggers the recognition of a bit, show durations for each bit, and pause the graph two durations after the last bit.

Unfortunately, an extra bit is being added at the end. The last bit is a little short, but still qualifies as a bit. Looking at the graph, I noticed that the green vertical lines didn’t accurately represent time – but more of a sample period. Sometimes I would get more samples during the duration that a signal occurs. Sometimes I would get less. This results in a graph that is not even when displaying the bit sample durations. It’s more obvious when the number of data points on the graph is reduced down to 100. We need to change our markers to represent time instead of a count of samples.
The first thing I did was to create an interface to pause the signal after it completes, so that I can control when to start/stop the graph. I also set it up to resume the graph once I send another signal.

Now, let’s change it to display time instead of count. I’m now plotting based on time instead of the index of the sample captured. Dropping down to 50 samples, it still feels like I’m seeing bit durations of varying sizes.

I think the issue may be when the green lines were captured. Although they are tied to a certain time period, they themselves are not accurate either. I think I need to at least plot a graph of exactly when milliseconds start/stop every Bit Duration (100ms). The idea is that all of the green lines should be consistent in how far or close they are within the 100ms boundaries.
Before all of that took place, I needed to re-evaluate the graph data points. Since we are now based on time, I needed to truncate based on time instead of the amount of samples collected. Depending on how often request animation frame is called, we may get a different count of samples per bit at varying times. I changed the graph so that instead of specifying the number of data points, we now choose how many bits the graph should display. I then multiply that value with the bit duration to determine the maximum duration of data to display. From there, I truncate data that is too old.
function truncateGraphData() {
  const duration = FREQUENCY_DURATION * MAX_BITS_DISPLAYED_ON_GRAPH;
  const now = performance.now();
  let length = frequencyOverTime.length;
  while(length !== 0) {
    const time = frequencyOverTime[length-1].time;
    if(now - time > duration) length--;
    else break;
  }
  if(length !== frequencyOverTime.length) {
    frequencyOverTime.length = length;
    bitStart.length = length;
  }
}
Now, let’s get on to displaying time on the graph. We already have a value called bitStarted that tells us when the first bit in the current data stream started. We can plot our bit separators off of this value to compare with the others.

What are we seeing here? The green lines follow closely with the yellow lines, but they never seem to be on point. They are always one sample behind. In face, you can see how the signal flips between red & blue directly on the yellow lines.
We don’t have control over how many samples per second we get, or when the samples occur. Expanding to only display 5 bits on the graph, I got a sample to display where the yellow and green line come very close to overlapping near the end.

function drawBitStarted(ctx, bitStarted, bitEnded, color) {
  if(!bitStarted) return;
  const { width, height } = receivedGraph;
  const newest = frequencyOverTime[0].time;
  const duration = FREQUENCY_DURATION * MAX_BITS_DISPLAYED_ON_GRAPH;
  ctx.strokeStyle = color;
  for(let time = bitStarted; time < newest; time += FREQUENCY_DURATION) {
    if(time > bitEnded) return;
    const x = ((newest - time) / duration) * width;
    ctx.beginPath();
    ctx.moveTo(x, 0);
    ctx.lineTo(x, height);
    ctx.stroke();
  }
}
Is there a way to increase the number of calls per second for requestAnimationFrame, or call something else? Frame rates for displays are usually good enough around 60 Frames Per Second. Audio samples are different. We need more of them. I’m only able to capture about 60 samples per second using this technique.
It looks like the web audio api has a method to create a script processor node. I can keep the requestAnimationFrame to draw out my graph, and use the script processor node to collect more samples per second. Before we move onto that, let’s show dots for each sample. it’s hard to see where my samples are captured on the graph unless I have hard angles.

That’s much easier to see. I can visually make out 6 samples in each bit. At 60 FPS and 100 ms bit duration, I can process 10 bits per second at most, with 6 samples per bit. That makes sense. Our frame rate is definitely limiting the number of samples we may collect.
Onto the script processor node… and it’s deprecated. Do they have something to replace it with? AudioWorklets and AudioWorkletNode. I keep getting sent down paths to create something similar to worker processes. It makes sense, but the audio worklets seem specific to processing audio, but not much in terms of communication other than sending a message and getting a reply. I would be running into the same issue as with requestAnimationFrame. Let’s take this down a different path. Let’s collect the data with an old fashioned interval.

Well, that turned out much better. It’s not fully wired up, but I’m grabbing more samples for each duration. I left the drawing of the graph to the renderAnimationFrame. Everything tends to line up much better now. Let’s finish wiring up the output to see if we have any changes in our data coming through.
Well now… well, well, well. It’s coming through perfectly. I’m uncertain what exactly I did that makes it better. I don’t have extra bits at the start or end. Anything I type comes through. I still need to wire up the samples per bit and give myself some control over the sample interval so that I can try to speed this up.

The main thing I would like to do now though is to give some information about how fast the data is being transferred. I need to know the “baud” (bits per second), as well as a better idea for bytes per second as well. Initially I was targeting 5KB in 10 seconds. I’m uncertain if I can pull it off given that I’m limited to specific frequencies and an amplitude threshold. The background noise outside is going to play a major factor given traffic, birds, crowds, radio, etc. A few beeps and tones is okay, but when I start using multiple frequencies and shorter durations for my data, it’s going to sound like noise. Noise is not pleasant to listen to.
Here we go. At 100ms, I’m transferring at 10 Baud (1.25 bytes per second). Blazing fast! I tried to make things faster by setting my sampling interval to 1 ms, and changing the bit duration to 10, bumping the speed up to 100 baud/12.50bytes. Things didn’t work out as expected. My modulated sound sounds like rapping something hard against wood really quick. I’m only getting 3 samples instead of 10, and not every bit is recognized.

Bumping the bit duration up to 30ms is almost perfect. 33 baud and 4 bytes per second. It sounds like a quick telephone ring. The falloff of the analyzer doesn’t drop fast enough and sometimes qualifies as an extra bit. Reducing the FFT Size to 2 ** 8 seems to do the trick.

If I reduce it further to 2 ** 7, the frequency tone for my high bits (400) isn’t recognized. Perhaps I need to get a bit smarter about the frequencies that I choose. Lowering it to 300 and 200 didn’t show up either. Bumping it up to 600, it appeared – but the analyzer couldn’t tell which frequency was higher.


Bumping up the frequency to 10,000, the analyzer is able to discern the high/low frequencies.

I can reduce the bit duration down to 25 seconds and “mostly” get all of the bits. This gets me to 40 baud (5 bytes/second). I’m not sure why the 8th bit didn’t come through on this one. Visually, I see all red dots above the blue dots. It may be an issue with qualifying against the “last bit percent”.

At this point, I think need to start figuring out the most optimal frequencies for the lowest FFT so that I can decrease the speed. From that point on, I can start experimenting with sending multiple bits simultaneously.
Doing a bit of research, it seems that higher FFT sizes are easier to distinguish frequencies from each other. Resolution is sampling range / FFT size. Let’s add something to our interface to show what the resolution is. Here is a table with the details:
| FFT Size | Sample Rate | Frequency Resolution |
|---|---|---|
| 2^5 | 48,000 | 1500.00 |
| 2^6 | 48,000 | 750.00 |
| 2^7 | 48,000 | 375.00 |
| 2^8 | 48,000 | 187.50 |
| 2^9 | 48,000 | 93.75 |
| 2^10 | 48,000 | 46.88 |
| 2^11 | 48,000 | 23.44 |
| 2^12 | 48,000 | 11.72 |
| 2^13 | 48,000 | 5.86 |
| 2^14 | 48,000 | 2.93 |
| 2^15 | 48,000 | 1.46 |
Holy smokes. No wonder the analyzer couldn’t discern anything at the lower FFT sizes. For 2**8, I needed to separate the two frequencies at least 187.5 Hz.
I am able to lower my bit duration to 20ms using frequencies 1kHz and 3kHz. It’s doing pretty well except for where it determines if a bit qualifies or is too short. I don’t think I can get a window interval to execute quicker than 3ms, no matter how low I set the value.
There is also something called the Nyquist Frequency. It’s half of the sampling rate. The audio context samples at 48,000 Hz, so half of that is 24,000 Hz. I need to use frequencies below that number. The average human can hear up to 20,000 Hz.
Let’s look back at tones from a telephone. It’s called the dual-tone multi-frequency (DTMF) signal for 16 digit keypads. It looks like each keypress sends an alternating signal between two frequencies. Maybe something will pop out like a pattern or even spacing of frequencies.
| Low / High Tones | 1209 Hz | 1336 Hz | 1477 Hz | 1633 Hz |
| 697 Hz | 1 | 2 | 3 | A |
| 770 Hz | 4 | 5 | 6 | B |
| 852 Hz | 7 | 8 | 9 | C |
| 941 Hz | * | 0 | # | D |
Well that’s interesting. Each row shares the same low tone, and each column shares the same high tone. I’m not seeing anything jump out with simple math with the different tones. 697 + 73 = 770. 770 + 82 = 852. 852 + 89 = 941… the numbers increase, but I don’t see the pattern.
Wikipedia for DTMF says that the Bell 400 style modem was based on touch-tone frequencies. 400 sounds like a baud rate. And here is the reference to the TV Typewriter Cookbook page 177-178. It mentions that the tone must exist for 40ms at 12 characters per second. It mentions filtering being absolutely essential for tone detection schemes. Am I doing the filtering manually, or am I supposed to apply some kind of filter to the microphone before processing the signal? This book is really cool. On 179 they go into a handshake where a modem sends 1070 and 1270 Hz sign waves for 0 and 1, and another modem answers at 2025 and 2225 Hz. Let’s plug some of these numbers and listen to the tone generated…
It sounds familiar, but not like a modem I’m used to. I needed an FFT size of 2**8 in order to recognize the two signals. 2025/2225 can be recognized at 30ms FFT 8. Same goes for 1070/1270. That’s 33 baud, 4.17 Bytes/second.
The book says the higher tone was used to disable echo suppression over long distance lines.
Okay, I’m not seeing much in terms of frequencies to pick. It’s mostly saying make sure it’s a frequency that doesn’t bleed over into another frequency, and doesn’t cause problems with microphones and noise.
What I’m looking for is a spread spectrum technique to use frequencies over a wide frequency band. In addition, I may look into frequency diversity to transmit the same data simultaneously over multiple frequencies so that if one frequency can’t get though, I can double-up the bits to send over a different frequency.
Anyhow, let’s do this. Lets just divide the whole band (20 Hz to 20 kHz) by the frequency resolution, and see how many frequencies we can accurately transfer with. We’ll still stick with sending the same bits, but over multiple frequencies.
| FFT Size | Frequency Resolution | Frequency Count |
|---|---|---|
| 2^5 | 1500.00 | 16 |
| 2^6 | 750.00 | 32 |
| 2^7 | 375.00 | 64 |
| 2^8 | 187.50 | 128 |
| 2^9 | 93.75 | 256 |
| 2^10 | 46.88 | 512 |
| 2^11 | 23.44 | 1,024 |
| 2^12 | 11.72 | 2,048 |
| 2^13 | 5.86 | 4,096 |
| 2^14 | 2.93 | 8,192 |
| 2^15 | 1.46 | 16,384 |
Well, that sound was a bit creepy. It remind me of the force field in Yar’s Revenge.

I’m noticing that amplitude is all over the place. I’m guessing that one end of the audio spectrum has problems with amplitude. Let’s try and bump up the minimum frequency.
Here we go. I’m limiting my frequency range between 5 kHz and 10 kHz. That’s 53 pairs of frequencies with FFT 10, 106 frequencies in all.

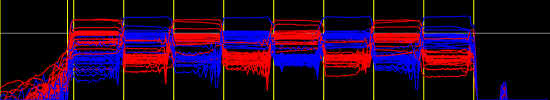
Let’s see if we can read the bits… sort of. I think the frequencies are bleeding over into each other. Instead of stepping every “frequency resolution” in Hz, I double it now. So instead of 46.88 Hz between frequencies, I double it to 93.76. The graph is a bit clearer. It looks like I may need to decrease the threshold. Most of the frequencies seem to have a middle point where that threshold should be.

Is it working? Yes. Mostly. My first bit has trouble being read and was only picked up on two frequencies. Following that, all 26 bits are picked up with the next four bits, followed by only 11 on the 7th bit, and then back to 26 on the 8th bit.

It appears that there is a problem with the threshold still. Let’s lower it a little bit more. Now this is really weird. I can visually see most of the blue lines above the threshold – yet none of them registered as a valid signal.

What’s even more interesting is that their is a blank line. Something was picked up, but nothing qualified…
Well, I figured it out. The problem was specifically with zero bits. You’ll notice that some came through, but not all. I wasn’t initializing my channels properly before counting up how many high bits came through.

Now that I can transfer multiple bits within the same sample, I needed to update my speed accordingly.
function showSpeed() {
  const segmentsPerSecond = 1000 / FREQUENCY_DURATION;
  const bitsPerSegment = getBitFrequencies().length;
  const baud = bitsPerSegment * segmentsPerSecond;
  const bytes = baud / 8;
  document.getElementById('data-transfer-speed-bits-per-second').innerText = baud.toFixed(2);
  document.getElementById('data-transfer-speed-bytes-per-second').innerText = bytes.toFixed(2);
}
With the new calculations, I was able to get the data to be mostly working at 60ms and a threshold of 150. I still got an occasional bit that was off, but my speed is at 433 Baud or 54 bytes per second. 433 baud… that’s fast enough to be an ancient modem! In addition, I’m only using a smaller portion of the spectrum and my FFT size is only 2 ^ 10.
The data isn’t perfect. Here are the bits I received for 01010101:
00000000000000000000000000
11111111111111111111111111
00000000000000000000000010
11111111111111111111111111
00000000000000000000000000
11111111111111111111111111
00000000000000000000000000
11111111111111111101111111
Close rite? It’s nothing that a little error checking couldn’t handle.
I’ve gone ahead and made a few more things configurable through the UI such as the frequency range and multiplier against the frequency resolution when creating frequency pairs for each bit. I’m about to get some sleep.

One response to “Multi-Frequency Signaling”
[…] was able to setup Multi-Frequency Signaling with the app yesterday, allowing me to increase the data-transfer speed around 300 to 500 baud […]