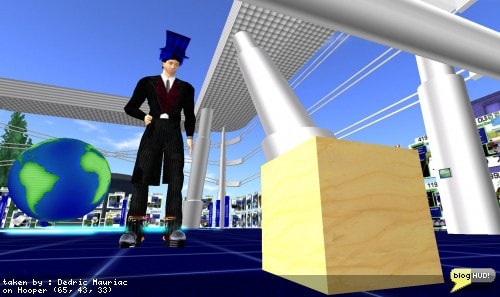
My projects always starts as a cube. This one is going to detect the language of people who pass by my store, and then display a pie chart along with a link to google charts. So far, I have it plugging into the same API that I use for my other statistical reporting charts. The last time I worked with in-world pie charts, it was for displaying the old rating system and land ownership in a Region Directory. From Dedric Mauriac via <a href="http://bloghud.com" rel="noreferrer nofollow">bloghud.com</a>
Original Details
- Original on Flickr: https://www.flickr.com/photos/dedric-mauriac/3280217569/
Location
- Simulator: Hooper
Text Found Within Image
- taken by : Dedric Mauriac on Hooper (65, 43, 33)
- blog HUD!