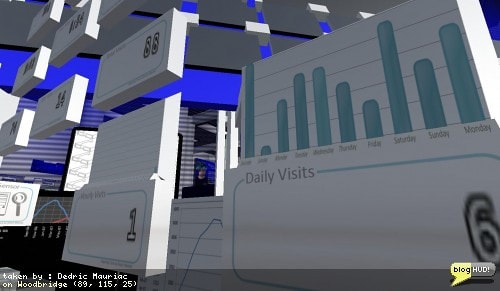
I've been working on creating bar charts in the virtual world of second life. These have got to be the most simple kind of charts to tackle first. I eventually want to go with pie charts and eventually lead up to a 100% stacked area chart. I have my hourly visitor counter bar chart fully working. The others shouldn't be too hard since the groundwork is laid out. I actually find myself comming up with different ideas for reporting. I have 10 reports completed, 3 different sensors, a set of communications between remote locations and another set to cross sim boundaries. I have another box to work on to upload statistics to a website. From Dedric Mauriac via <a href="http://blogHUD.com" rel="noreferrer nofollow">blogHUD.com</a>
Original Details
- Original on Flickr: https://www.flickr.com/photos/dedric-mauriac/2145116939/
Location
- Simulator: Woodbridge
Text Found Within Image
- taken by : Dedric Mauriac on Woodbridge (89, 115, 25)
- Daily Visits